Species
- Sand bug (Thenus australiensis)
- Mud bug (Thenus parindicus)
Fish stock status
Although a species may be classified as sustainable under the Status of Australian Fish Stocks (SAFS) framework, this does not mean that the stock is meeting Queensland targets under the harvest strategy.
| Stock | 2023 | 2020 | 2018 | 2016 | 2014 |
|---|---|---|---|---|---|
| East Coast Otter Trawl Fishery | Sustainable | Sustainable | Sustainable | Sustainable | Sustainable |
Stock assessment
The 2023 stock assessment on sand bug and mud bug used current biological, survey and commercial catch data to estimate the:
- biomass of each biological stock
- fishing pressure on each biological stock.
This assessment used delay-difference biomass models, based on previous stock assessments.
13 model scenarios were run for each species , covering a range of modelling assumptions.
Sand bug biomass
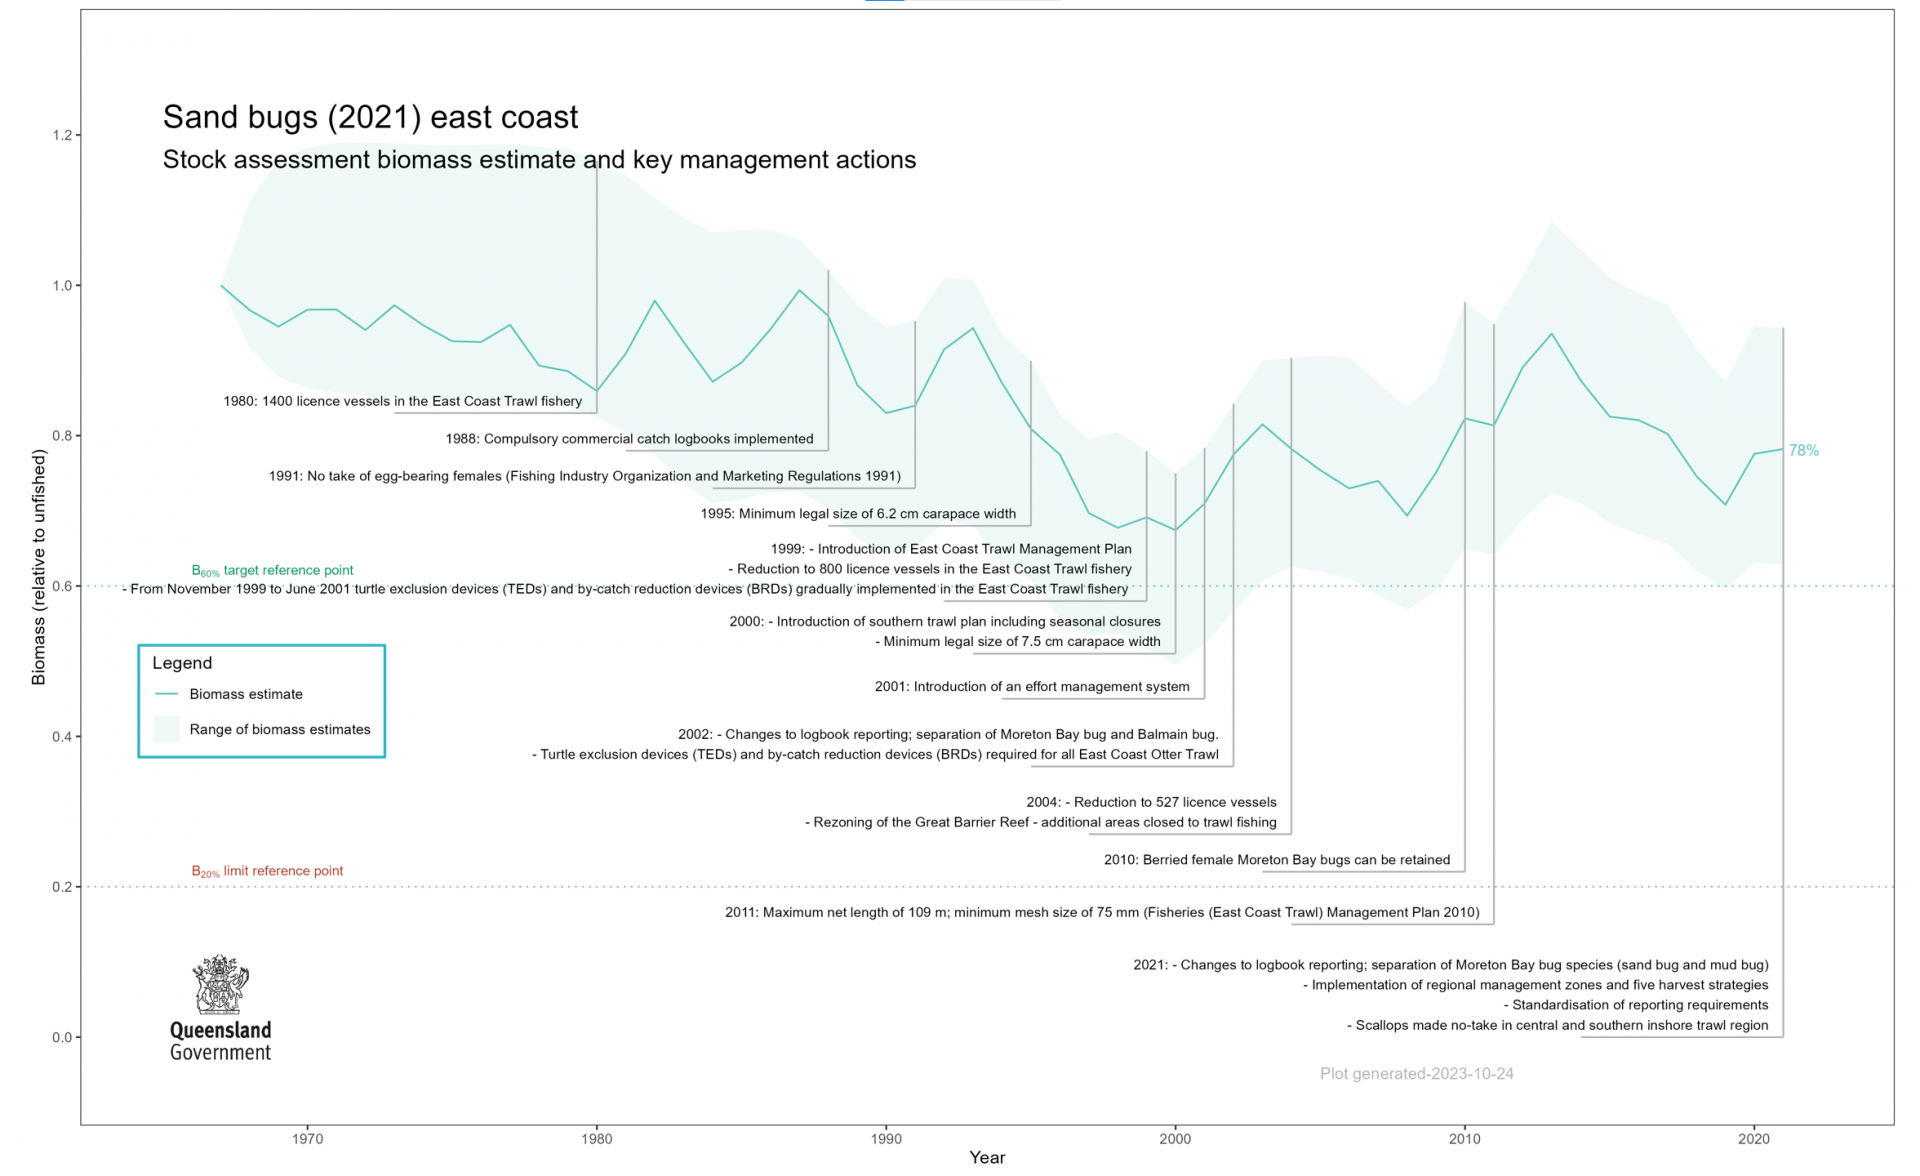
Results for the base case (project team preferred) scenario indicated that biomass in 2021 was between 63% and 94%, most likely at 78% for the east coast sand bug stock north of 26 degrees latitude.
Biomass estimates and key management actions
The chart presents the biomass ratio of sand bugs from 1968 to 2021. The ratio is relative to unfished biomass in 1968. Data used in the stock assessment includes 53 years of commercial catch.
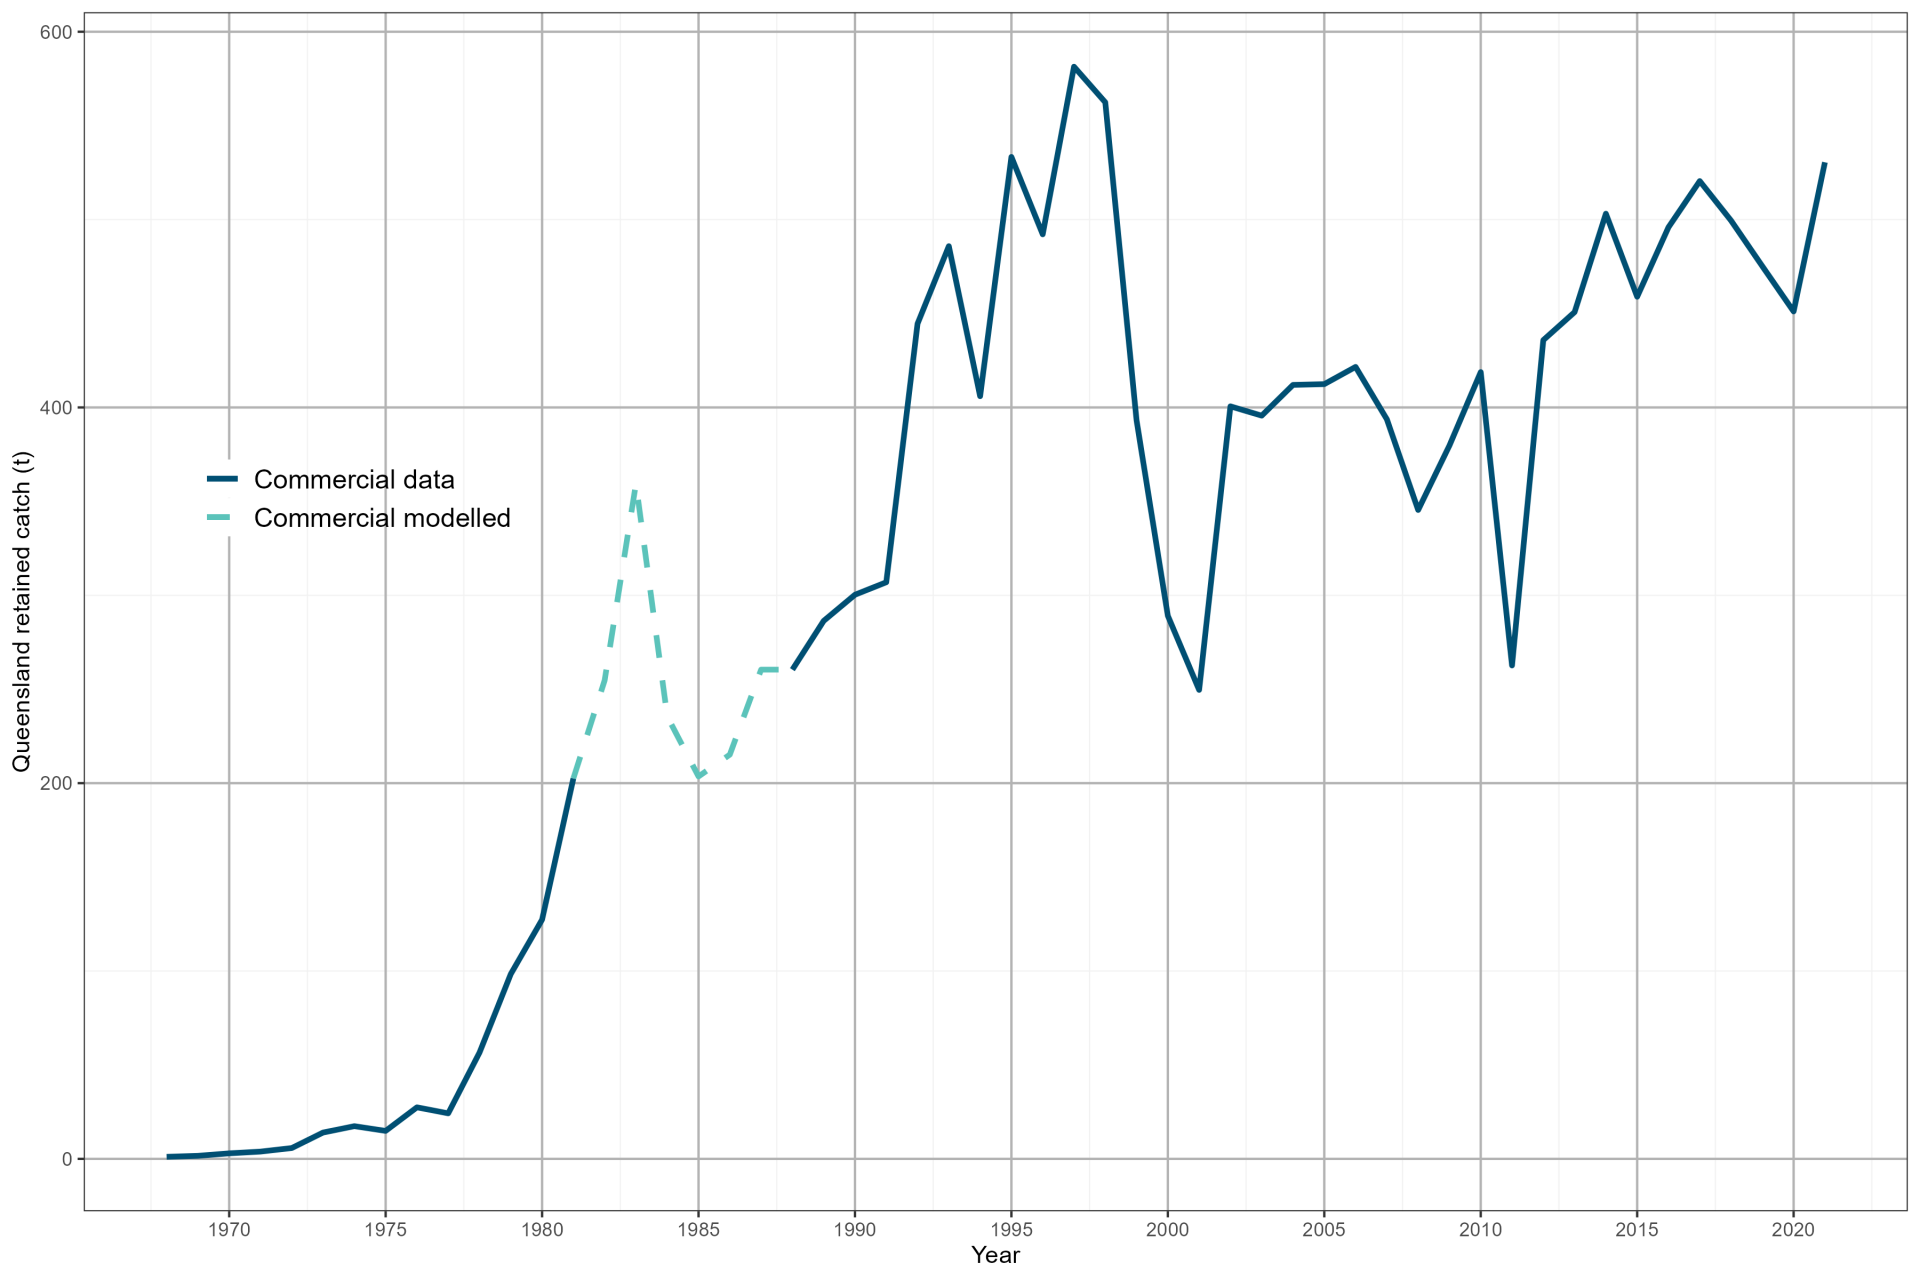
Estimated retained catch from 1968 to 2021
The chart presents retained catch for sand bug on the east coast of Queensland. The chart shows the data used and the modelled retained catch for the commercial sector.
Mud bug biomass
The status of the mud bug stock is undefined.
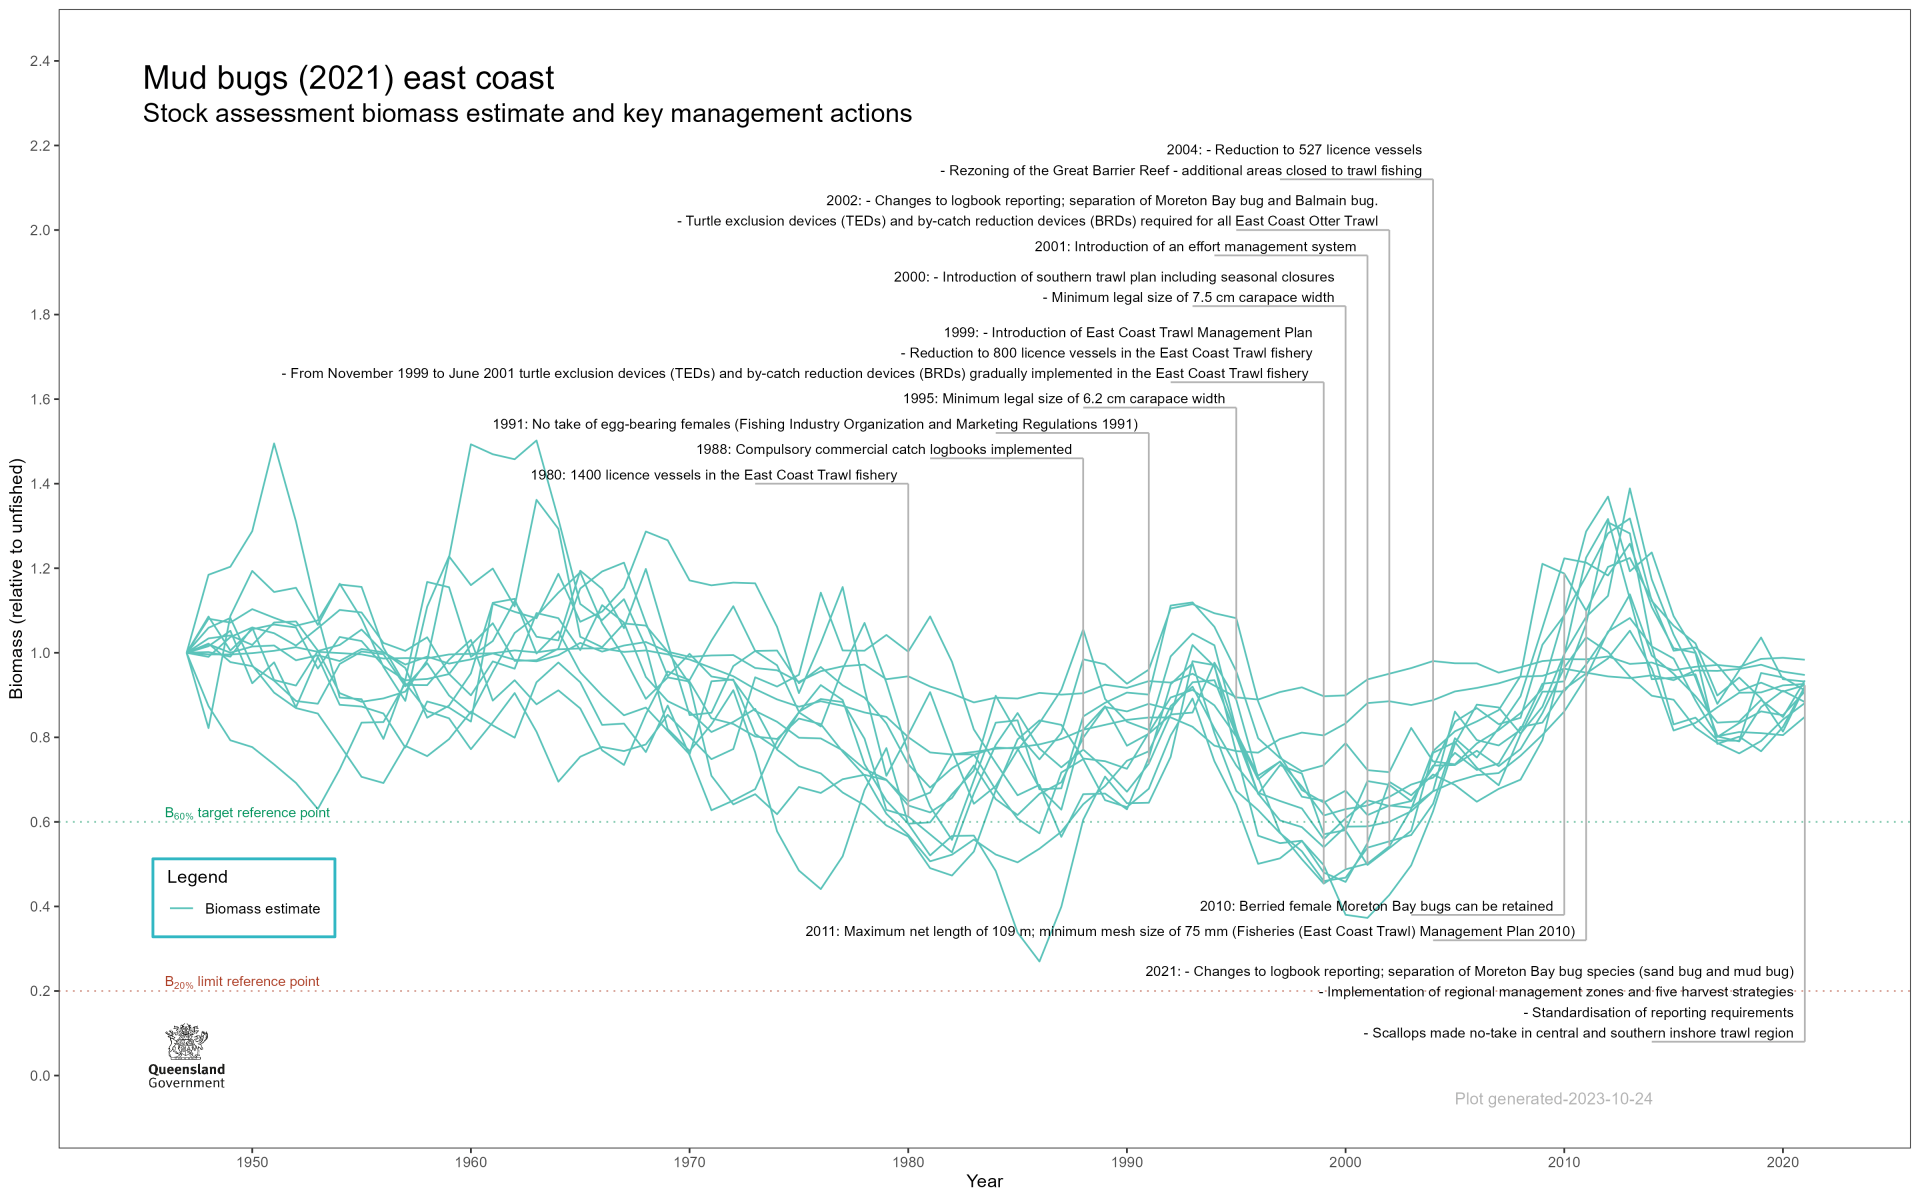
The general trajectory across the 13 scenarios shows the biomass experienced a decline from the period of 1968 until the mid-1980s, then slowly recovered since that time.
Seven scenarios had convergence problems, or diagnostics that indicated issues. The non-target nature of the fishery combined with fishery-dependent catch rates being the primary data set for model tuning makes assessment difficult.
Biomass estimates and key management actions
The chart presents the biomass ratio of mud bugs from 1948 to 2021. The ratio is relative to unfished biomass in 1948. Data used in the stock assessment includes 73 years of commercial catch data.
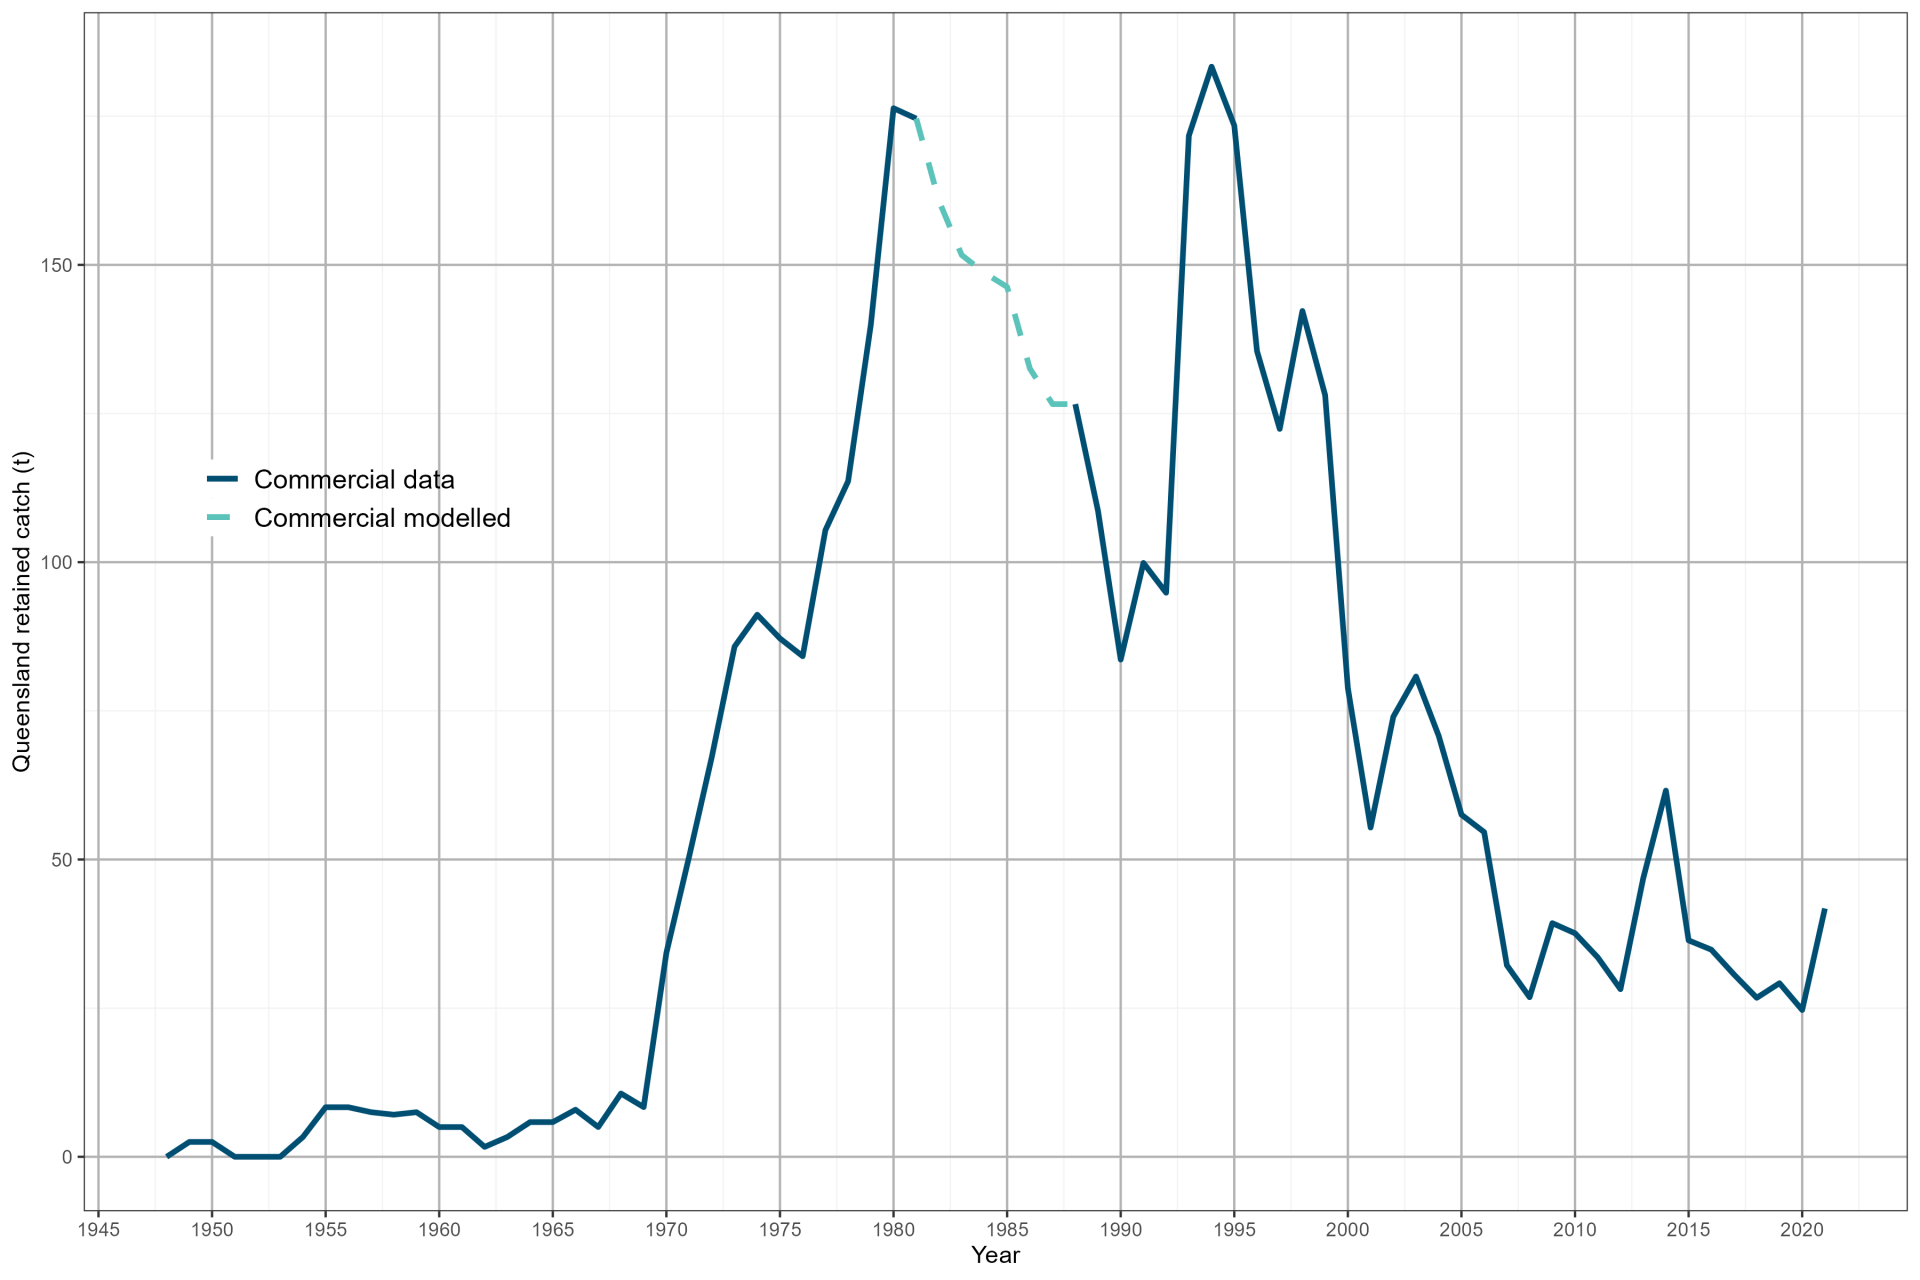
Estimated retained catch from 1948 to 2021
The chart presents the biomass ratio of mud bugs from 1948 to 2021. The ratio is relative to unfished biomass in 1948. Data used in the stock assessment includes 73 years of commercial catch data.
Project team
The stock assessment project team for both species had a wide range of skill sets, and included:
- managers, scientists, monitoring and data specialists from our department
- 3 industry representatives
- an external scientist.
The team operated under the terms of reference (PDF, 154KB) to ensure a transparent and evidence-based approach.
We thank the project team for contributing their time and knowledge, and engaging constructively over the course of a 16-month project.
We acknowledge the significant time commitment and deep operational and technical expertise of our industry representatives. The project has benefited greatly from their input. Future assessments should continue to engage with industry members to further enhance assessments and build collaboration between industry and government.
Ecological risk assessment
Assessed in the:
- 2018: Southern Queensland east coast otter trawl fishery and river and inshore beam trawl fishery (PDF, 4MB)
- 2012: East coast otter trawl fishery in the Great Barrier Reef Marine Park (led by the Great Barrier Reef Marine Park Authority)
Management
East coast otter trawl fishery:
Last updated: 03 Dec 2024