Species
- Saddletail snapper (Lutjanus malabaricus)
Fish stock status
Although a species may be classified as sustainable under the Status of Australian Fish Stocks (SAFS) framework, this does not mean that the stock is meeting Queensland targets under the harvest strategy.
| Stock | 2023 | 2020 | 2018 | 2016 | 2014 |
|---|---|---|---|---|---|
| East Coast Queensland | Sustainable | Undefined | Undefined | Undefined | Undefined |
| Gulf of Carpentaria | Sustainable | Sustainable | Sustainable | Sustainable | Sustainable |
Stock assessment
The 2026 stock assessment used current biological data, as well as commercial and recreational catch data, to:
- determine the status of the fish stock
- inform application of the reef line harvest strategy
- inform management decisions.
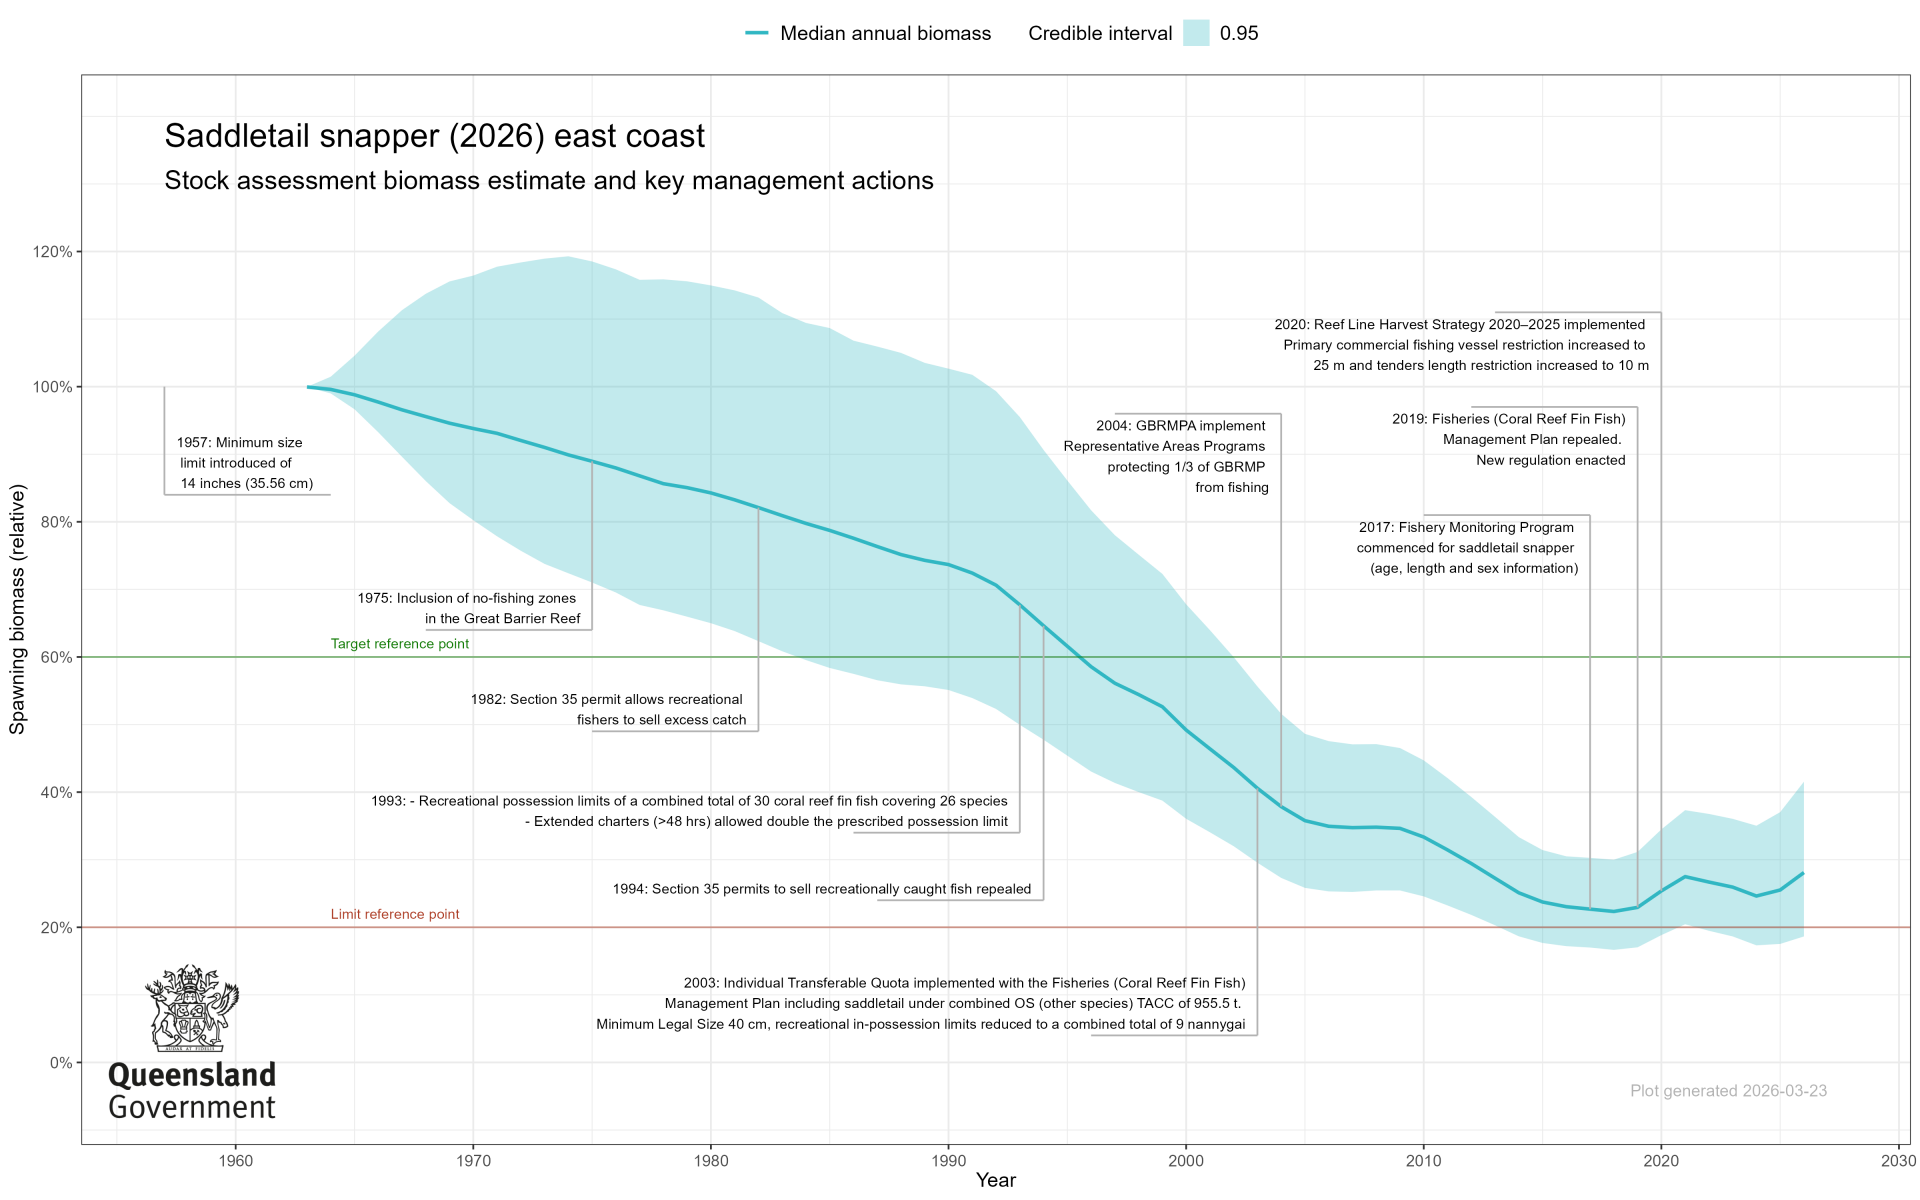
This assessment estimated that the number of saddletail snapper (biomass) was between 19% and 42% of unfished levels, and most likely around 28%.
2026 stock assessment summary
Watch this video about the 2026 stock assessment and results.
Show transcript
Introduction and Acknowledgement of Country
Hi, my name is Alise and I'm a stock assessment scientist with Fisheries Queensland, part of the Department of Primary Industries and I'm one of the authors of the 2026 stock assessment of Queensland east coast saddletail snapper, also known as large-mouth nannygai.
And today I'm going to take you through the latest assessment results: what's changed since the last assessment in 2021, the key data that we used, how the model works and, of course, how the stock is doing now.
This video is just a summary of the work done. The assessment report contains a lot more detail on the process and results. We put a link to that in the video notes below. We've also included chapters in this video so you can jump straight to the parts that you're most interested in.
I would like to respectfully acknowledge Aboriginal people and Torres Strait Islander people as the Traditional Custodians of the country in which this video was recorded. I pay my respects to the Elders past and present, and I extend that respect to all Aboriginal people and Torres Strait Islander people who may be listening to this video. This video was recorded on beautiful Gubbi Gubbi Country.
Updates since the previous assessment
This stock was previously assessed in 2021. Since then we've improved several parts of the assessment process.
Firstly, this work was led by a project team who met formally three times over the course of the assessment. Now, the project team typically includes fishery scientists, biologists and fishery managers from within the Department, but this time it was expanded to also include three fishing industry representatives from the commercial, recreational and Traditional Owner sectors, an independent scientist from the Western Australian Department of Primary Industries and Regional Development, and a representative from the Great Barrier Reef Marine Park Authority. This diversity brought valuable on-water experience as well as additional scientific perspectives.
Secondly, we had five more years of data available to us, catch, effort, length and age, up to June of 2025. This means that we've doubled the time series for the length and age data inputs compared to the previous assessment. Now length and age data are incredibly valuable for helping us understand the biology of saddletail, like how they grow, die and reproduce, as well as how likely it is that they'll get caught; factors which are crucial to reliable biomass estimation.
Depredation
We also included new data on depredation rates, that is the amount of saddletail snapper that were hooked on a line but never made it onto the boat because of predators underwater like sharks. We've heard a lot of reports from fishers that changes in shark populations and their behaviours are affecting the way that fishers can catch saddletail snapper.
In this assessment, we used data on depredation rates to add an extra amount of fish removed from the population for each year, and for each fishing fleet, to account for the saddletail snapper that we assumed are taken by predators. This is indicated by the lighter shading on this graph. Now there's a degree of uncertainty associated with depredation rates, so we did additional modelling to cover some extra "what if" scenarios looking at different ratios of landed to depredated saddletail.
Ultimately across all this extra modelling, we only saw a 6% difference in the final biomass estimate. In this assessment, we had five more years of boat ramp survey data to work with. We used the data to look at recent trends in recreational harvest. We also used the data set to create a recreational catch rate time series, which gives us an idea of trends in the fish population over time.
Previously, we only had this data for the commercial sector. We also reassessed our commercial catch rates. In this assessment, we accounted for long-term changes to fishing efficiency, that is, your ability to catch fish overtime based on your gear, technology and experience.
Spatial consideration
Finally, we did a separate round of analysis to look for any changes in the length and age of fish over time or area.
We know that the way fishers interact with the fishery changes up and down the coast of Queensland and some species are known to grow at different rates in different areas. So we want to make sure that we're representing the whole population as best we can with our modelling. For example, if the data showed different growth rates or different size availability by area, it would be best to split their data up into areas and treat them separately within the model. That way we don't risk making incorrect assumptions about these important aspects.
From analysing the data that we have, there was no evidence that would support a more complex, area-based model through our assessment. Even still, we account for regional differences in fishing through the methods that we use to prepare our catch rates and our length data sets.
Modelling scenarios
Lastly, the results of this assessment represents the outcomes of many model scenarios, with no one scenario given preference over the others. This approach lets us explore multiple plausible scenarios at once and gives us a clearer picture of uncertainty across all potential models.
We call this an ensemble approach, and it's different from what the previous 2021 stock assessment did, which presented results on a single base case, which is a preferred or most plausible scenario chosen by project team members.
The ensemble in the current assessment included twelve different plausible scenarios, and these scenarios include variations on three key decisions.
The setting of steepness, which is a modelling term that describes the relationship between the size of the population and the number of new fish recruited that population each year.
The setting of natural mortality, which is the rate at which saddletail die of natural causes unrelated to fishing.
And the method we used prepare our length data set. Looking at all the combinations of these three modelling decisions, we ended up with ensemble of 12 scenarios which captures the most influential factors upon biomass estimates. W
e explored many other model scenarios before deciding on this final ensemble, such as different depredation rates, fishing efficiency trends, and fishing selectivity patterns. However, ultimately these scenarios didn't really impact your final biomass results, or they resulted in poor quality model fits. Still, we've written about these extra scenarios in the appendix of the stock assessment report.
Biomass results
So what's the result? Across all model scenarios in the ensemble, the median biomass estimate for 2026 was 28% of unfished biomass, which is also referred to as a biomass ratio. This comes with a modelled 95% confidence range of 19 to 42%.
In other words, the stock has depleted by 72% since 1961. Our confidence in the result has improved since last time, which estimated the biomass ratio at the beginning of 2021 to be 23% with a broad, 95% confidence interval of 13 to 73%. Thanks to the considerable additional data and modelling improvements, the range of uncertainty in our results is now a lot smaller, meaning we could have much greater confidence in this new result.
Now let's take a look at how we got to those numbers. We do some modelling framework called Stock Synthesis to produce results for our 12 model scenarios in the ensemble. From there, we ran an extra step of analysis to explore how certain we are of those results.
This process is called an MCMC algorithm and it reruns the model, in our case a quarter of a million times for each scenario, each with slightly different starting conditions. This lets us understand how stable our model is and also gives us a better understanding of model predictions and precision.
Our results consider all twelve of our model scenarios equally and account for any uncertainty relating to modelling decisions. We didn't have to pick a most likely scenario for the decisions we really weren't sure about. This helps reduce the risk of model misspecification.
Once we ran all those models, we combined all the results for the 2026 biomass produced by every model iteration, which you can see in this orange band. Because we ran the model so many times across all 12 scenarios, it means we have 3,000,000 estimates for the biomass at the beginning of 2026.
Now of course telling you 3,000,000 estimates for biomass wouldn't be very helpful, but if we organise the results into larger groups we can see a curve starting to form.
Now this curve summarises all of our 3 million biomass estimates at the beginning of 2026. 95% of all biomass ratio estimates fell between 19 and 42%. That's indicated by these vertical dashed lines.
So there's a 95% chance the current biomass ratio falls within this range. The solid vertical line you can see shows that the median biomass ratio estimate is 28%. This represents the most probable estimate for biomass for 2026 across all the model runs. The yellow shading indicates that there's a 91% chance the current biomass ratio falls between 20 and 40%. This is the highest probability shown by any of these coloured brackets.
Key findings
A few factors had the strongest influence on the outcomes.
We tested two plausible values of natural mortality and three plausible values for steepness. These parameters are notoriously difficult to estimate in most stock assessment models, so we explored a sensible range and reported across all of them.
We use two different methods to prepare the length composition data. One geared towards representing the size distribution of fishery removals and one representing size distribution of the population. This approached produced some of the biggest differences between scenarios. Because saddletail enter the fishery at just three years of age, the most recent years of the model relied more heavily on catch rates. Both recreational and commercial catch rates showed increases since 2022 and this was reflected in the biomass trajectory.
Based on project team feedback, depredation is assumed to have increased substantially over the past decade. It was important to include this extra amount of fish lost due to predators to give us a more accurate estimate of fishing pressure. By having more depredation data, especially over time, we will be able to help refine future assessments.
Acknowledgement and summary
This assessment benefited so much from a broader project team that included members with on-water experience and an independent perspective on stock assessment science.
Thank you so much for your insight and support. We now have a clearer picture of the stock than ever before. And these results will support management discussions moving forward. So there you go.
If you like to read the full report, a link is available in the description below. And if you have questions, please reach out to us at Fisheries Queensland. You can email us at fisheriesassessment@dpi.qld.gov.au. Thanks for watching.
Previous stock assessment
Differences from previous assessment
Several key aspects of this assessment differ from the previous assessment:
- Membership of the project team that guided the assessment was expanded to include:
- fishery stakeholders (1 commercial fisher, 1 recreational fisher and 1 Traditional Owner fisher)
- an independent scientist
- a Great Barrier Reef Marine Park Authority representative.
- Catch reconstruction accounted for additional mortality due to depredation.
- Five additional years of catch, effort, length and age data were included (2021–2025).
- Catch rate indexes were adjusted for long-term changes in fishing efficiency.
- Recreational catch rates were included as an additional index of abundance (2017–2025).
- Recreational harvest beyond 2020 was estimated using observed changes of indexes of recreational fishing effort and recreational catch rates.
- The key outputs (including biomass estimates) were constructed from multiple model scenarios rather than selecting a particular preferred scenario, and used a Markov chain Monte Carlo estimation framework rather than maximum likelihood estimation.
Biomass estimates and key management actions
Chart of Australian east coast stock assessment biomass estimates and key management actions for saddletail snapper from 1961 to 2026.
Estimated retained catch
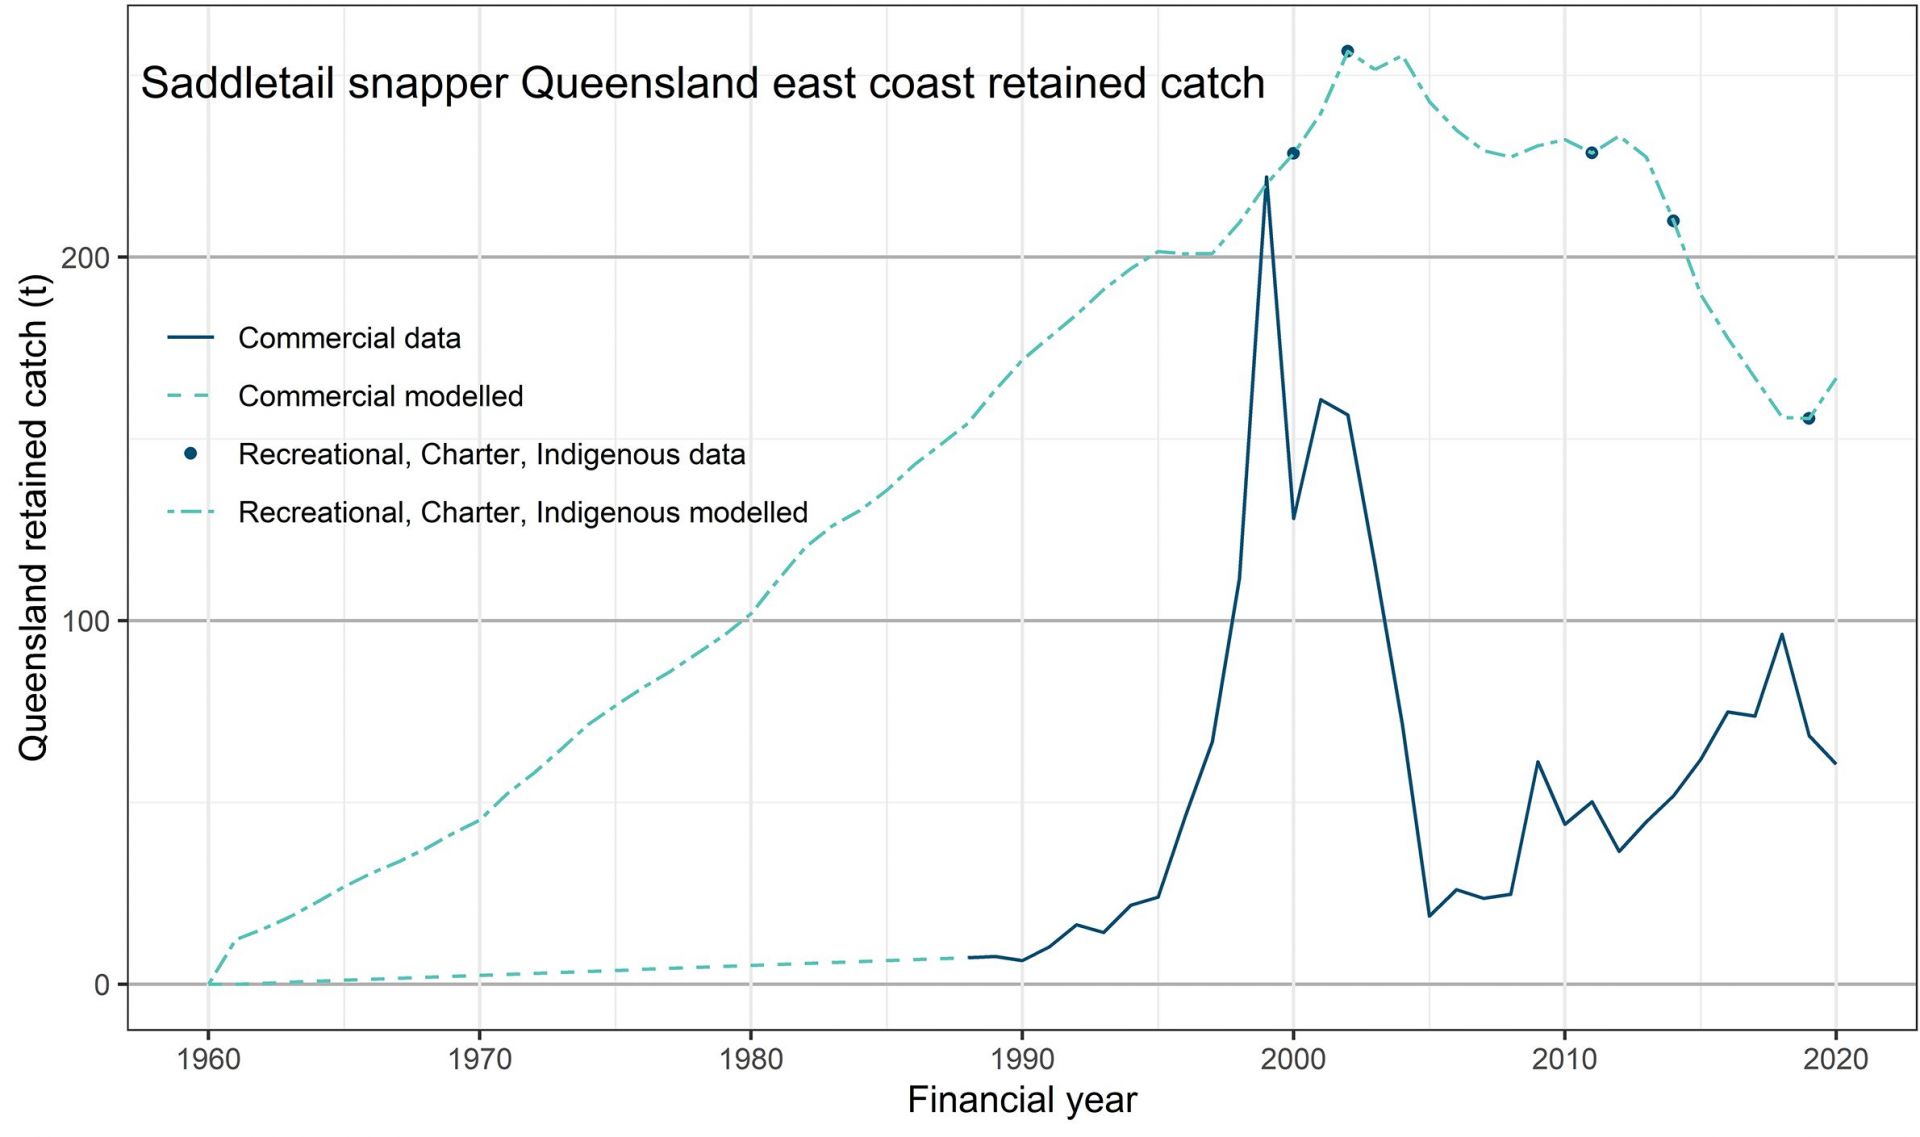
The chart presents retained catch for saddletail snapper on the east coast of Queensland from 1961 to 2025.
The chart shows the data used and the modelled retained catch for the commercial and charter, recreational and indigenous sectors.
Monitoring
Saddletail snapper are included in the coral reef fish biological monitoring program.
Ecological risk assessment
- reef line fishery
- Gulf of Carpentaria development fin fish trawl fishery.
Management
Reef line fishery:
Last updated: 30 Mar 2026