Species
- Ballot’s Saucer Scallop (Ylistrum balloti)
Fish stock status
Although a species may be classified as sustainable under the Status of Australian Fish Stocks (SAFS) framework, this does not mean that the stock is meeting Queensland targets under the harvest strategy.
| Stock | 2023 | 2020 | 2018 | 2016 | 2014 |
|---|---|---|---|---|---|
| North Eastern Australian | Undefined | Undefined | Sustainable | Not Assessed | Not Assessed |
| South Eastern Australia | Sustainable | Sustainable | Sustainable | Not Assessed | Not Assessed |
| Northern Australia | Negligible | Negligible | Negligible | Not Assessed | Not Assessed |
| Central Eastern Australia | Negligible | Negligible | Not Assessed | Not Assessed | Not Assessed |
Stock assessment
The 2023 stock assessment used current commercial catch and survey data to:
- determine the sustainability of the stock
- help inform management decisions.
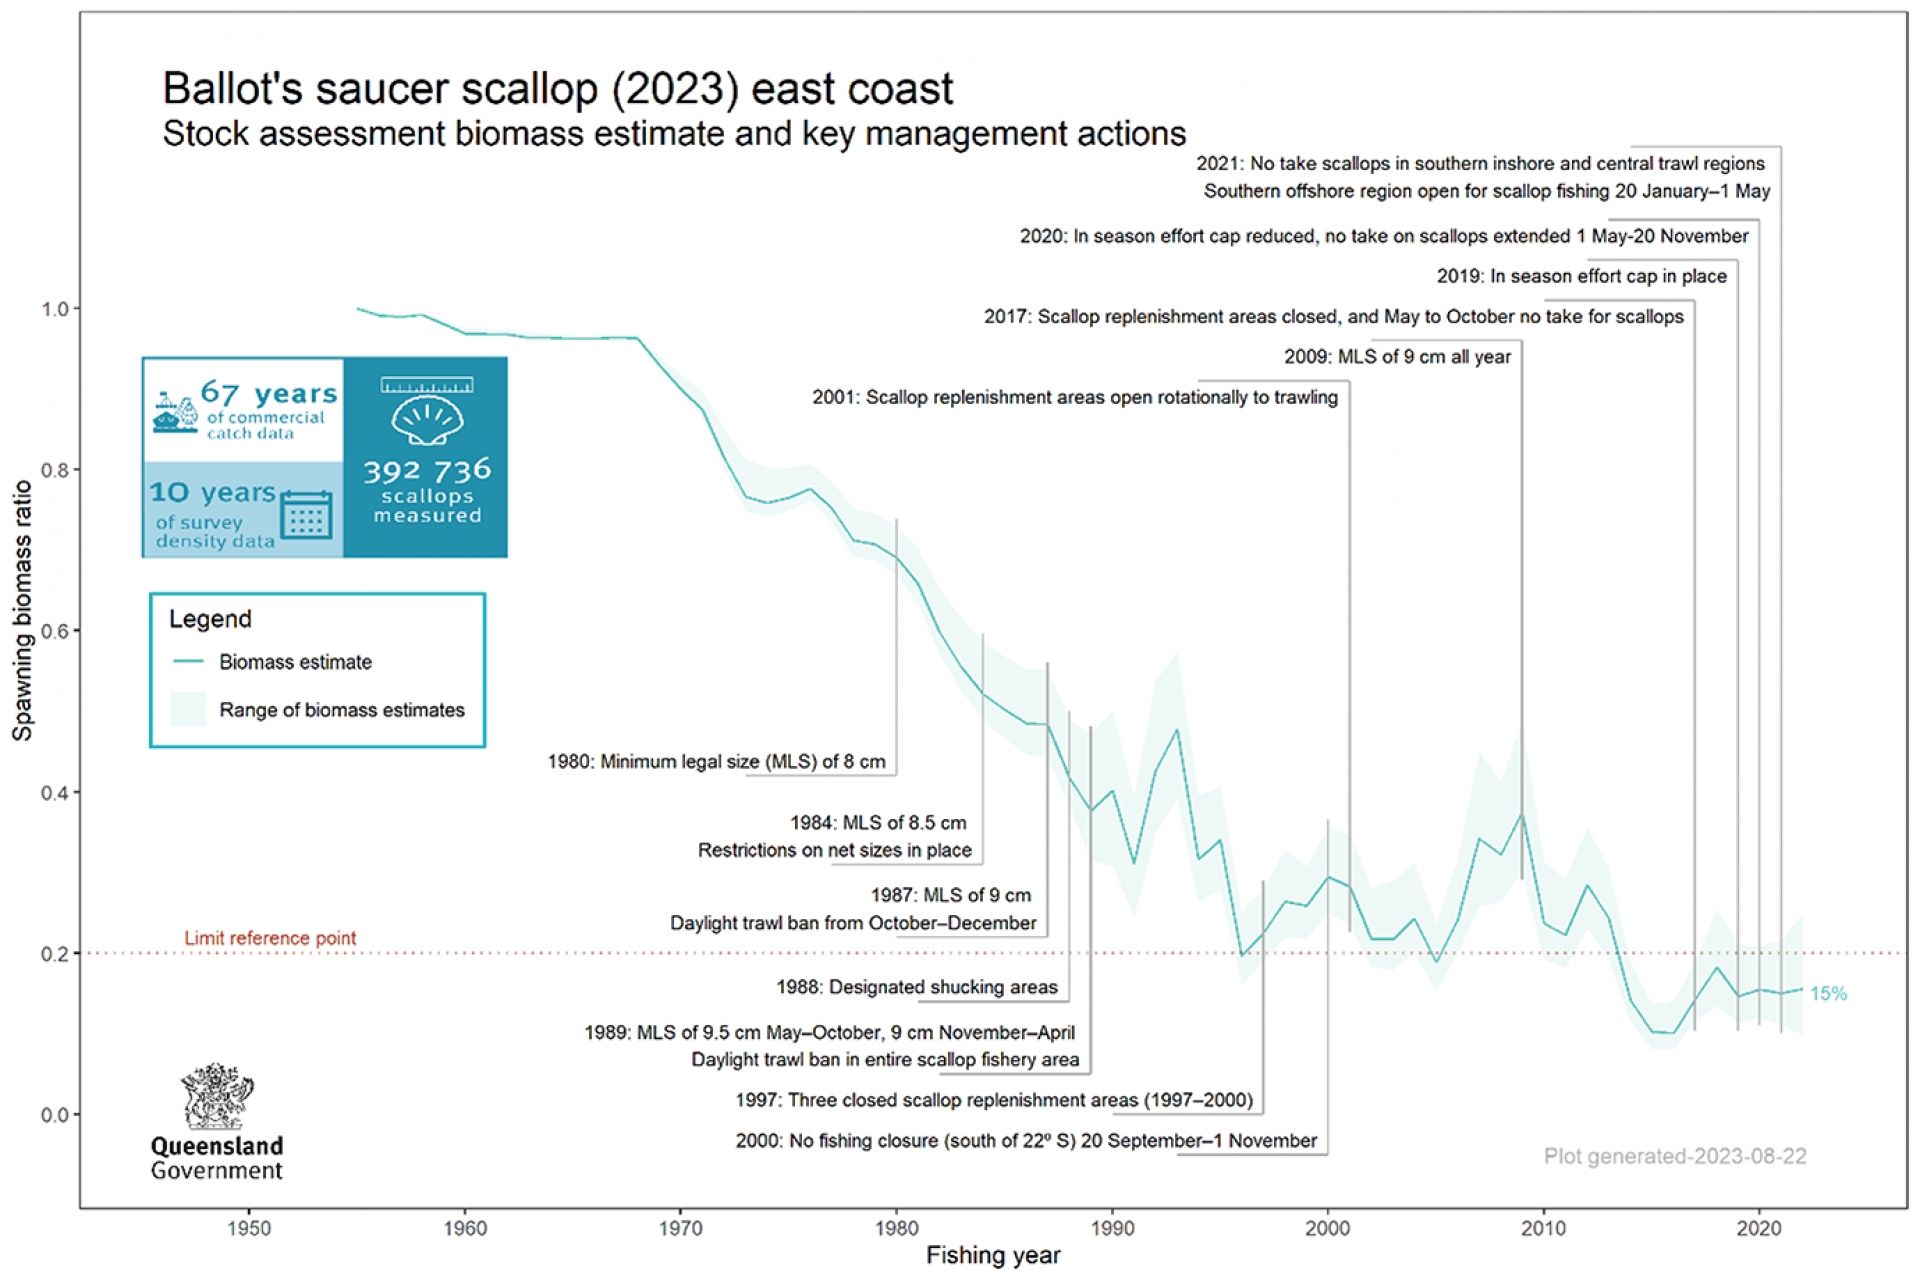
This assessment estimated that the saucer scallop stock was between 10% and 25% of unfished levels, and most probably at around 15%.
The assessment used an age-structured population model with a monthly time step, based on the methodology from the previous assessments.
Previous reports:
Biomass estimates and key management actions
The chart presents the biomass ratio of Ballot’s saucer scallop from 1956 to 2022. The ratio is relative to 1 in 1956. The biomass ratio declined between 1956 and 2016 to 10% unfished biomass, after increasing to 18% in 2018, the biomass ratio in 2022 was estimated at 15%.
Data used in the stock assessment includes 67 years of commercial catch data, 392,736 scallops measured and 10 years of survey density data.
The various management measures that have been implemented over time are detailed. Before 1987, minimum legal size limits were less than 9cm and since 1987 seasonal minimum legal size limits of 9cm and 9.5cm were applied. Since 1997 spatial closures have applied, including rotational closures from 2001 to 2016 and the current permanent closures.
As of November 2021 there is no take of scallops in the southern inshore and central trawl regions.
Estimated retained catch
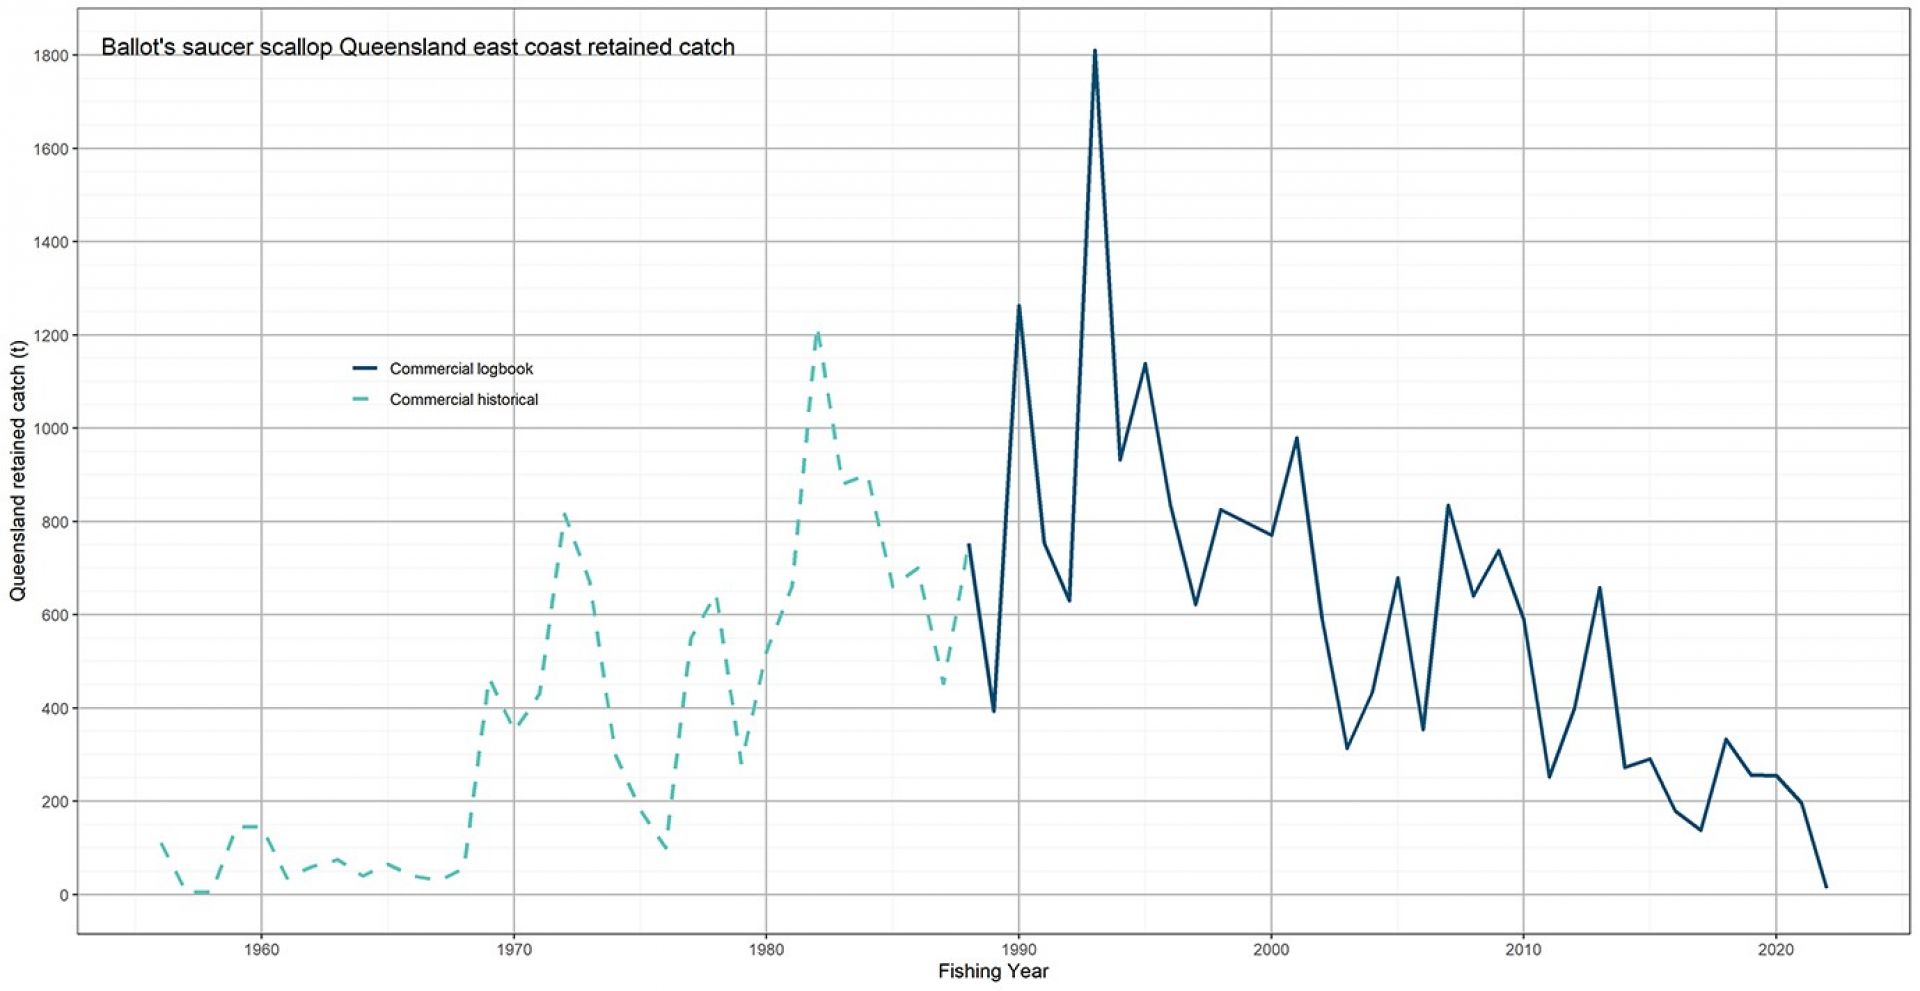
The chart presents the Ballot’s saucer scallop retained catch taken by commercial fishers from 1956 to 2022.
The commercial harvest is from a historical source between 1956 and 1988 and from the logbook program between 1987 and 2022. Before 2022, retained catch estimates from the logbook were greater than 700 tonnes of meat weight per fishing year, and peaked in 1993 at over 1800 tonnes.
Since 2011, retained catch estimates were less than 400 tonnes per fishing year.
Monitoring
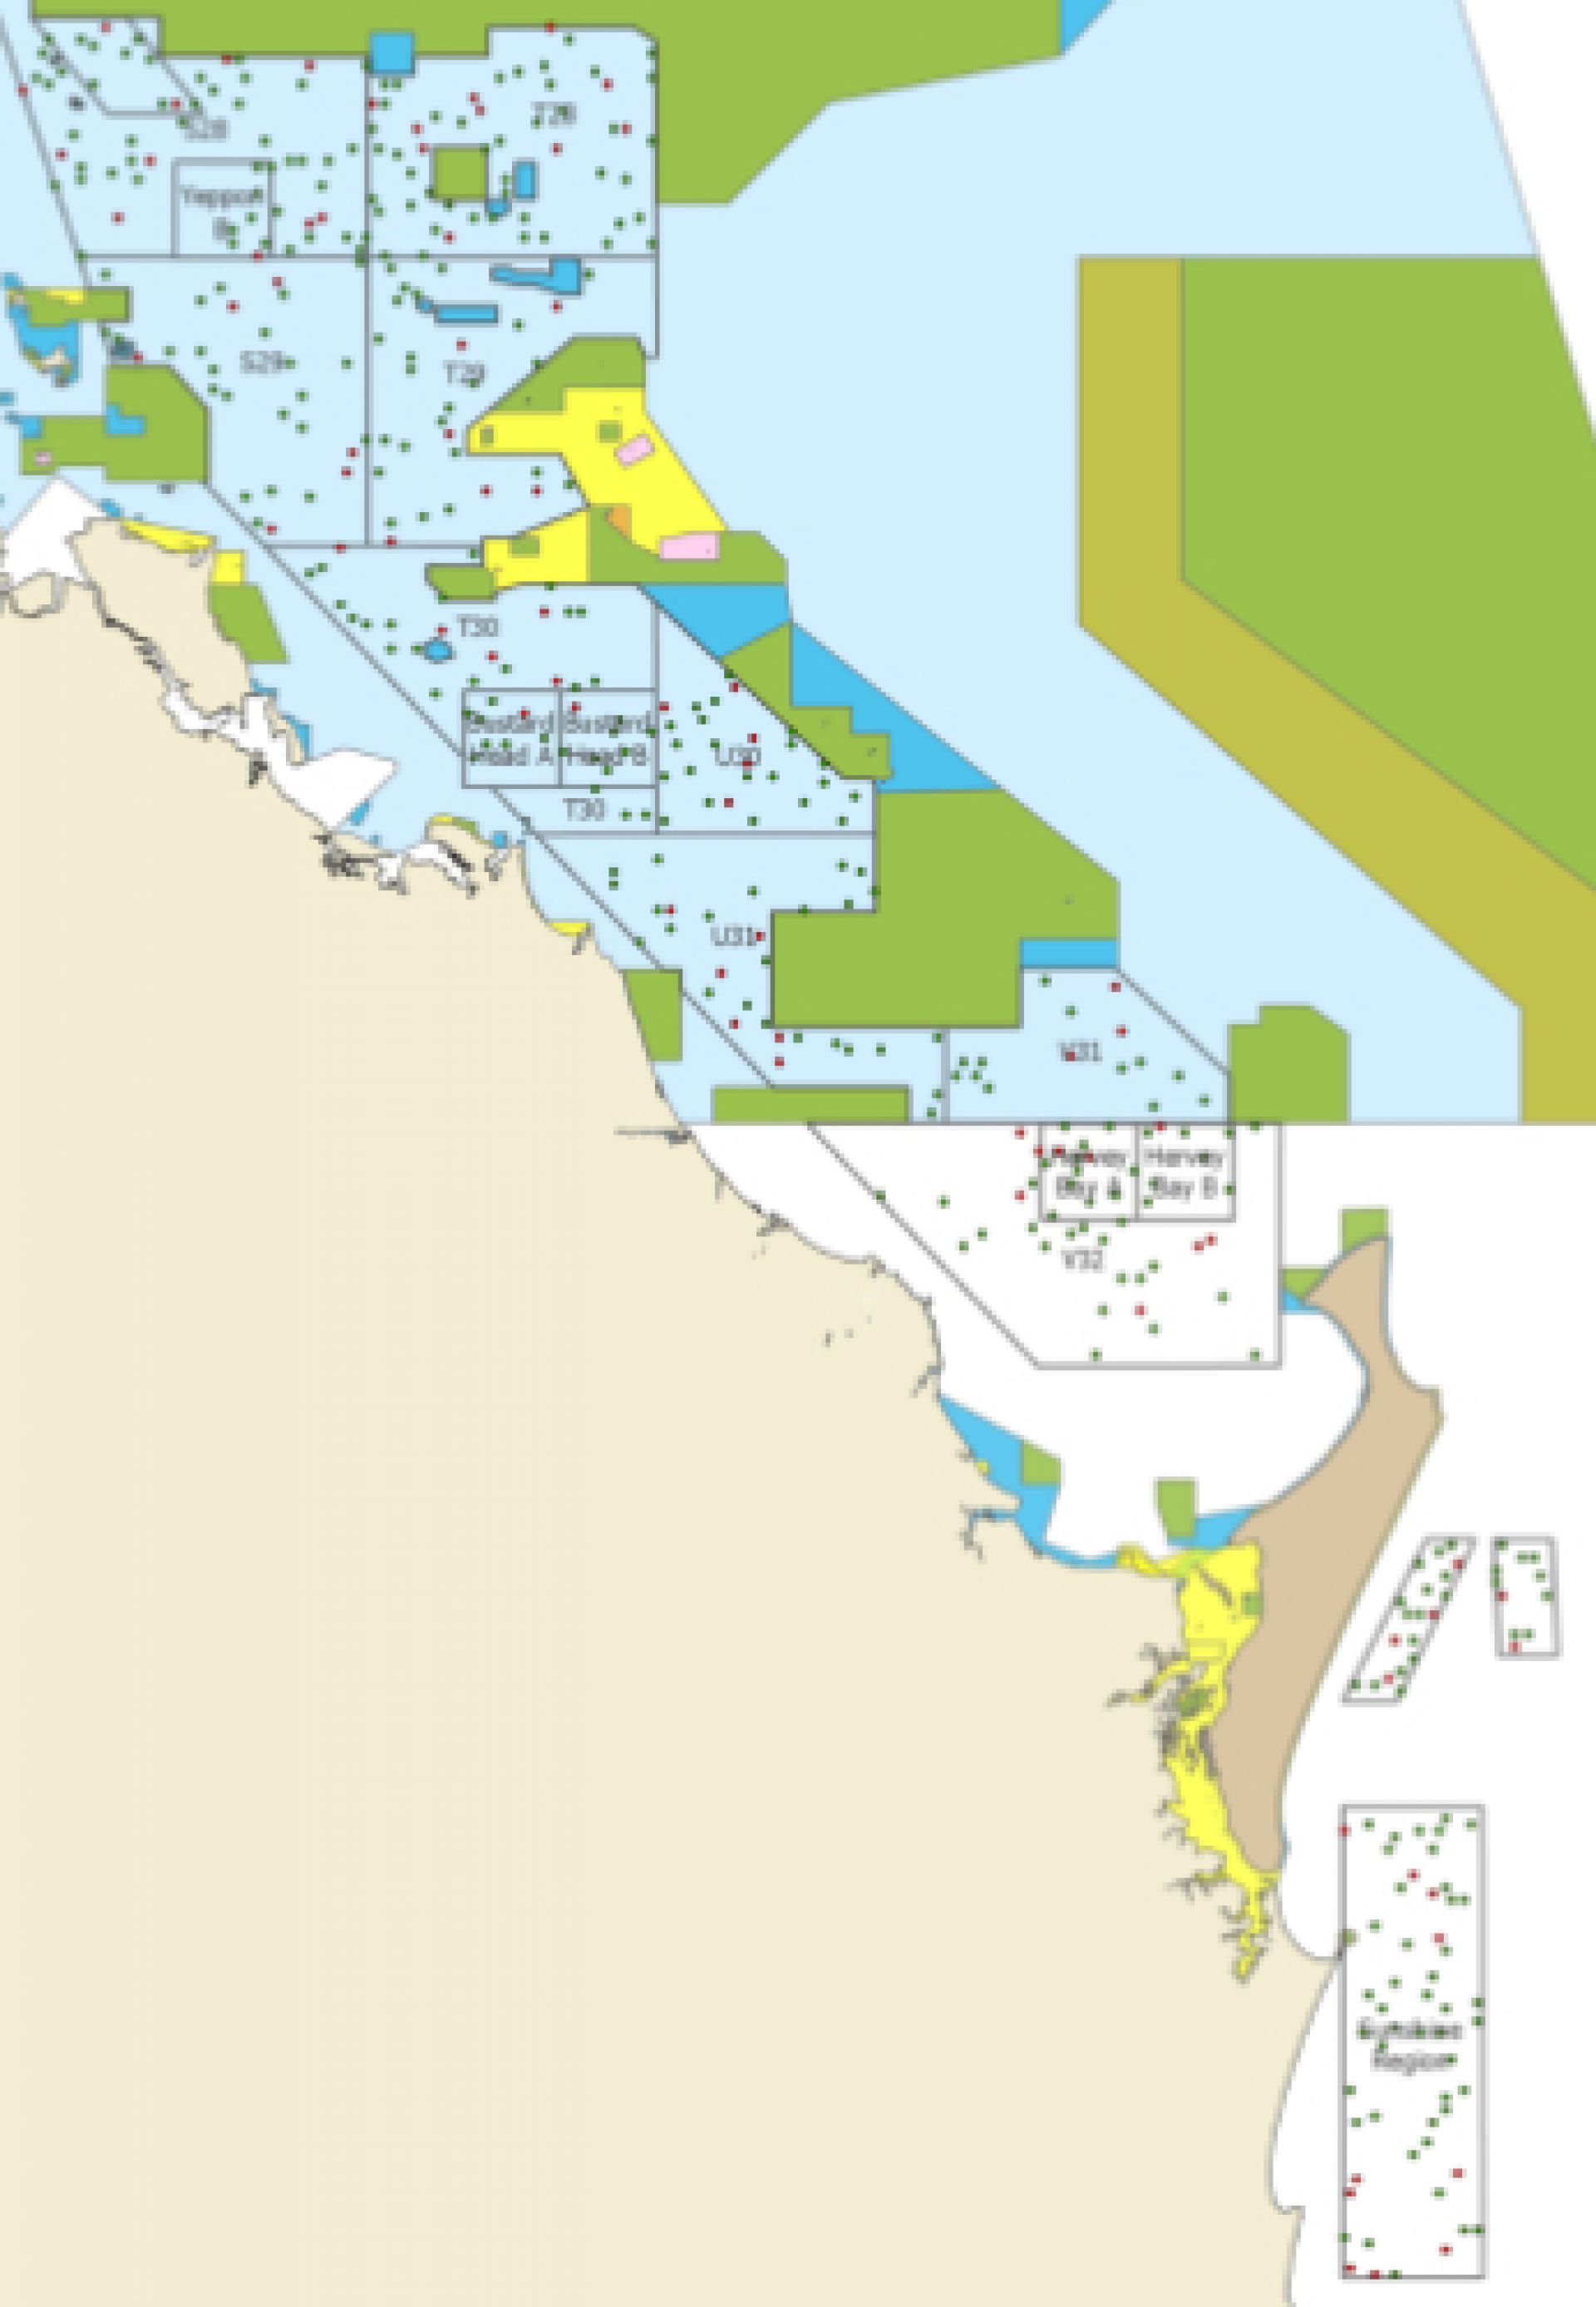
Saucer scallops are monitored through a fishery independent survey. The survey aims to determine abundance of small size and legal size scallops within areas of their known distribution.
The survey has been completed from 1997-2006 and from 2017 onwards.
Prior to 2006, the survey was conducted from offshore Yeppoon to Hervey Bay. However in 2017, the survey restarted with trawled strata moved as far south as Noosa to reflect the southern movement of the fishery’s major harvest.
Results
All 1997–2006 survey data is presented in the Scallop Survey Results (1997-2006) report.
Survey design
The survey is run in October, with over 300 sites within 18 survey strata, including the scallop replenishment areas (SRAs) sampled.
Commercial trawlers are chartered by the department to undertake the work, with DAF staff onboard to count and measure the scallops.
At each site, a 1 nautical mile or 20 minute tow using common east coast commercial prawn trawl gear is completed. Prawn nets are used to capture very small (pre-recruit) scallops (less than 15mm shell height), as well as large adult scallops.
To help standardise catch rates and test the performance of each vessel, side-by-side trawls are completed on the first evening of the survey. This testing allows different gear configurations and vessels to be compared. Each vessel then conducts as many shots as possible at randomly allocated unique locations to collect information on the size and abundance of scallops.
Data is also collected for Moreton Bay bugs and blue swimmer crabs.
Ecological risk assessment
Assessed in the:
- 2018: Southern Queensland east coast otter trawl fishery and river and inshore beam trawl fishery (PDF, 4MB)
- 2012: East coast otter trawl fishery in the Great Barrier Reef Marine Park (led by the Great Barrier Reef Marine Park Authority).
Management
East coast otter trawl fishery:
Last updated: 10 Jul 2024